Crypto is loud by nature. Prices jump, narratives collide, timelines move at breakneck speed. One rumor can move a market. One headline can erase weeks of calm. But beneath all that noise, blockchains behave very differently.
Every action leaves a trace.
That quiet, permanent record is what on-chain analysis is built on. It’s the practice of stepping away from opinions and looking directly at what people are doing on a blockchain. Who’s moving funds. Who’s holding. Where activity is increasing. Where it’s drying up.
In 2025, that perspective matters more than ever. Markets are more efficient, retail is better informed, and blind speculation gets punished faster. Understanding on-chain data isn’t about chasing signals anymore. It’s about learning how to read behavior at scale.
What Is On-Chain Analysis? A Clear Definition
On-chain analysis is the study of data that lives directly on a blockchain.
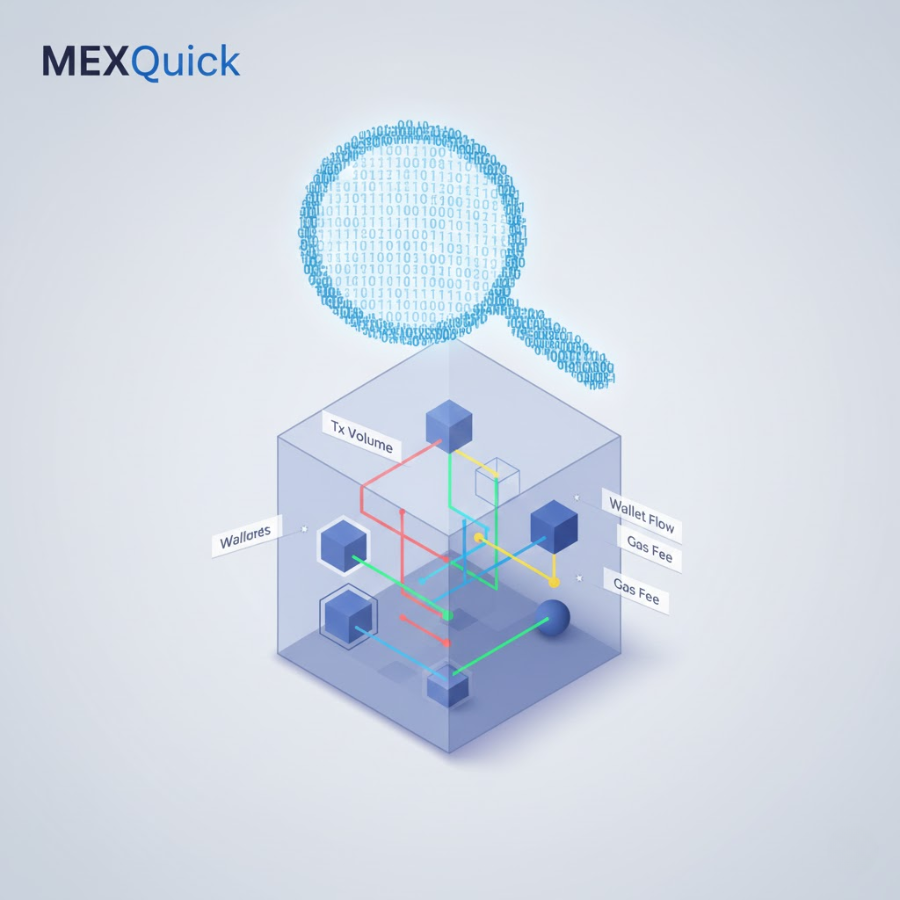
That includes every transaction, wallet balance change, contract interaction, and fee payment that gets written into a block. Nothing here is estimated or inferred. It’s all verifiable, public information that anyone can access.
At its core, on-chain analysis asks a simple but powerful question: what are network participants actually doing with their assets?
That’s what separates on-chain analysis from most market commentary. It’s grounded in behavior, not belief.
How Blockchain Data Is Collected and Interpreted
To really understand on-chain analysis, you need to know how blockchain data exists and how it becomes readable.
Blockchain as a Public Ledger
Every blockchain functions as a shared ledger.
When a transaction is made, it gets grouped with others into a block. That block is validated by the network and added to the chain. Once confirmed, it becomes part of the permanent record.
This means:
- No retroactive edits
- No hidden transactions
- No selective reporting
Anyone, anywhere, can inspect the same data. That openness is rare in finance, and it’s the foundation that makes on-chain analysis possible.
Role of Nodes and Indexers
Nodes are the machines that store blockchain data and validate activity. They ensure the network stays honest and synchronized.
But raw blockchain data isn’t designed for humans. It’s technical, dense, and difficult to navigate. This is where indexers come in.
Indexers take raw data and:
- Organize transactions by type
- Track wallet balances over time
- Identify contract interactions
- Make historical data searchable
Without indexers, on-chain analysis would still exist, but it would be limited to highly technical users.
How Blockchain Analytics Tools Work
Analytics tools sit on top of nodes and indexers.
They:
- Pull structured data from the chain
- Convert it into metrics
- Display it visually
Charts, heatmaps, tables, and alerts don’t create insight on their own. They just make patterns easier to see. The real work happens when someone slows down and interprets what those patterns actually mean.
Key On-Chain Metrics to Understand
There’s no shortage of metrics in on-chain analysis, but most useful insights come from a handful of core ones.
Some of the most widely used include:
- Active addresses, which hint at real user participation
- Transaction count, showing how often the network is being used
- Transaction volume, reflecting how much value is moving
- Exchange inflows and outflows, often linked to continous trading behavior
- Wallet balance distribution, which shows whether supply is concentrated or spread out
These metrics don’t speak loudly on their own. They become meaningful when viewed together, over time.
How to Read On-Chain Data
Reading on-chain data isn’t about reacting quickly. It’s about observing carefully.
Single-day spikes are rarely important by themselves. What matters is direction, consistency, and divergence.
Useful questions to ask include:
- Is activity growing steadily or spiking suddenly?
- Is usage increasing while price stagnates—or the opposite?
- Are long-term holders behaving differently than short-term participants?
On-chain analysis works best when it challenges assumptions instead of confirming them.
Practical Exercise — What Is an Example of On-Chain Analysis?
Imagine you’re tracking a blockchain and notice the following over several weeks:
- Exchange inflows gradually increase
- Larger wallets begin moving dormant funds
- Transaction fees trend upward
None of this guarantees anything. But together, it paints a picture of rising activity and possible repositioning. That’s the essence of on-chain analysis—building context from observable behavior, not making bold predictions.
How to Do On-Chain Analysis Step-by-Step
A simple structure keeps analysis useful.
- Focus on one blockchain at a time
- Define a clear question before opening charts
- Select only metrics related to that question
- Compare short-term movements with long-term trends
- Add external context where needed
Most confusion comes from trying to analyze everything at once.
Wallet Behavior and Fund Flow Tracking
Wallet behavior is one of the most revealing parts of on-chain analysis.
Some wallets accumulate slowly and rarely move. Others trade constantly. Observing how balances change over time helps distinguish conviction from speculation.
Fund flow tracking looks at how assets move between:
- Private wallets
- Exchanges
- Smart contracts
Network Health Metrics — Understanding Fundamentals
Price can rise or fall for many reasons. Network health is slower and harder to fake.
Healthy blockchains tend to show:
- Consistent transaction demand
- Gradual growth in active addresses
- Stable fee markets
- Ongoing contract usage
Comparing On-Chain vs Off-Chain Analysis
Off-chain analysis looks at everything else:
- Exchange mechanics
- Regulation and policy
- Macroeconomic pressure
- Market narratives
On-chain shows what’s happening. Off-chain helps explain why pressure exists. Together, they form a more complete picture.
Limitations of On-Chain Analysis
Key limitations include:
- One person can control many wallets
- Off-chain trades leave no on-chain trace
- Patterns don’t guarantee outcomes
Popular On-Chain Analytics Tools
Most analytics platforms rely on similar underlying data. What differs is presentation, depth, and focus.
Some prioritize accessibility. Others cater to advanced users. No tool replaces disciplined thinking.
How On-Chain Analysis Supports Research & Transparency
Claims can be checked. Assumptions can be challenged. Data can be verified by anyone. That level of transparency changes how research is conducted and debated.
It’s not about being right. It’s about being verifiable.
The Bottom Line
On-chain analysis doesn’t eliminate uncertainty. It reduces blind spots.
In a market filled with narratives, it offers a way to ground understanding in real behavior. In 2025, learning how to read blockchain data isn’t a niche skill anymore. It’s a foundation for thoughtful research and informed decision-making.
FAQ’S
Is on-chain analysis only for traders?
No. Researchers, developers, and long-term participants use it extensively.
Can on-chain analysis predict market moves?
It highlights behavior and conditions, not guaranteed outcomes.
Is on-chain data trustworthy?
The data is accurate. Interpretation depends on the analyst.